It's Oktoberfest time!
get a load of this graph from the guys at Powerline and Political Calculations:
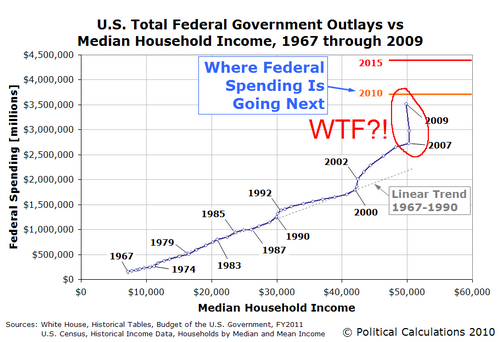
You can see that from the late 60's up until 2000 federal spending was pretty much a straight line relative to the median household income. Then jumps to a new higher growth rate around 2002 (most likely due to 9/11). But look at what happened in 2007 when the Democrats took over the House.
Ho-ly crap!
Not only did federal spending shoot up but median income actually fell. This isn't just new unsustainable growth - this is an effin death spiral where spending has become completely decoupled from people's incomes. This is the kind of graph you see in engineering when a system is heading into failure. A few more years of this and we will be in Greek bankruptcy territory.
So if you're looking for a single chart that crystallizes the current greatest danger to the US and why the Tea Party has appeared, this is it.
Oh Yeah It's Oktoberfest Time
And this year marks the 200th anniversary of the first one which was held in 1810 to mark the wedding of Crown Prince Ludwig. Traditionally it starts in September and ends after the first weekend in October but this year it will run for 17 days to celebrate the anniversary. So hoist some brews as part of the world wide virtual Oktoberfest.

And of course what event would be complete without a little Kardashian fame-whoring.

posted by Mr. Punky Kitten @ 12:20 PM
0 comments
![]()
![]()


0 Comments:
Post a Comment
<< Home